
温馨提示:本文最后更新于
2025-06-09 15:19:58,某些文章具有时效性,若有错误或已失效,请在下方留言。MatPlotLib 的作用是绘制2D/3D图形,让深度学习可视化。具体的使用步骤
- 引入
MatPlotLib库 - 使用
MatPlotLib绘制图像
重要概念
- Figure(画布)
- Axes(坐标轴)
基本流程
![图片[1]-MatPlotLib 的使用-Stewed Noodles 资源](https://oss.stewednoodles.com/2025/06/09/202a83a63ab9c73adc6e0de4ff0c926e.jpg)
- 创建Figure(画布)
- 在画布上创建Axes坐标轴对象
- 在坐标轴绘制图形,如散点图、折线图…
绘图
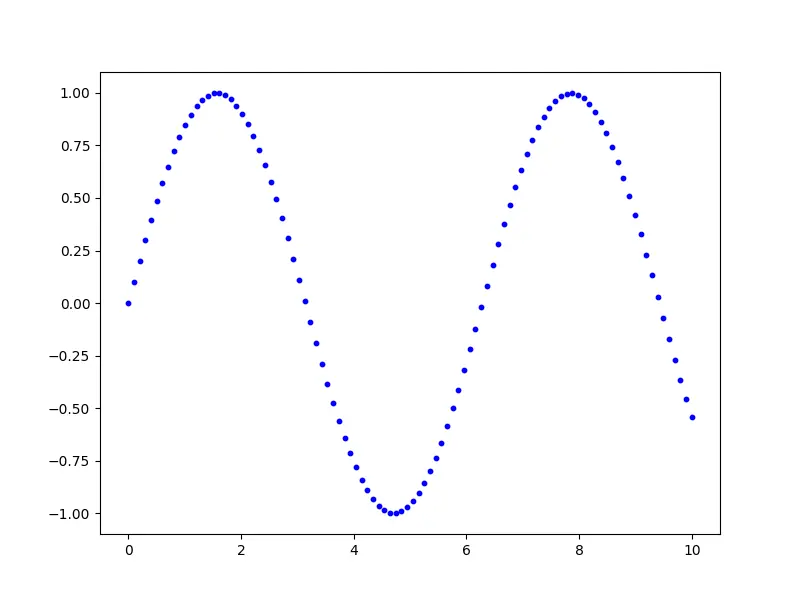
散点图
import matplotlib.pyplot as plt
import numpy as np

# 创建一个画布
fig, ax = plt.subplots(1, 1, figsize=(8, 6))

# 创建数据
x = np.linspace(0, 10, 100)
y = np.sin(x)

# 绘制散点图
plt.scatter(x, y, color='blue', label='sin(x)', s=10)
# 显示图形
plt.show()
绘制的图形,如下所示
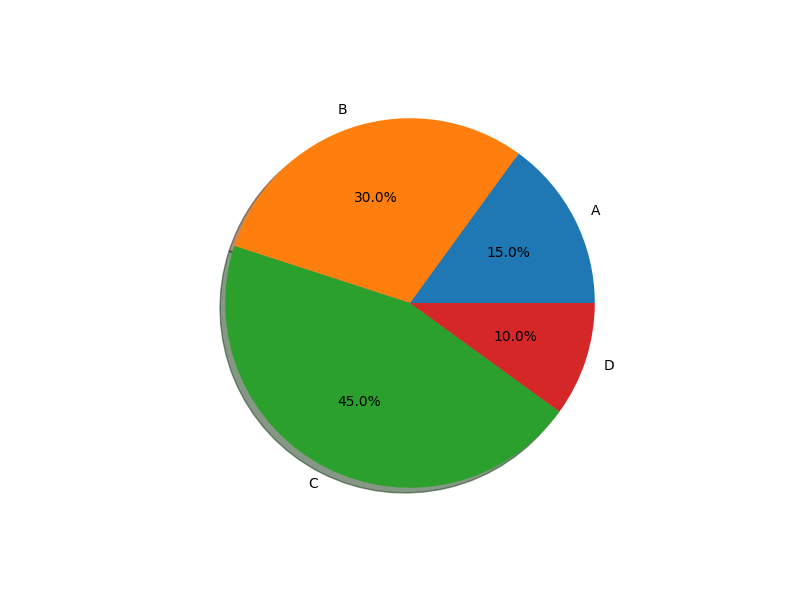
饼状图
import matplotlib.pyplot as plt
import numpy as np

# 创建一个画布
fig, ax = plt.subplots(1, 1, figsize=(8, 6))

# 绘制饼状图
sizes = [15, 30, 45, 10]
labels = ['A', 'B', 'C', 'D']
plt.pie(sizes, labels=labels, autopct='%1.1f%%', shadow=True)

# 显示图形
plt.show()
同时绘制
import matplotlib.pyplot as plt
import numpy as np

# 创建一个画布
# 画布是1行2列(两个坐标轴 ax[0]以及ax[1]),画布尺寸为8英寸*6英寸
fig, ax = plt.subplots(1, 2, figsize=(8, 6))

# 创建数据
x = np.linspace(0, 10, 100)
y = np.sin(x)

# 绘制散点图
ax[0].scatter(x, y, color='blue', label='sin(x)', s=10)

# 绘制饼状图
sizes = [15, 30, 45, 10]
labels = ['A', 'B', 'C', 'D']
ax[1].pie(sizes, labels=labels, autopct='%1.1f%%', shadow=True)

# 显示图形
plt.show()

THE END


暂无评论内容